In our last post: https://www.discretionarydystopia.com/backwardation-pt1-the-m1-m2-vx1vx2-spread/
We described the fundamental meaning of VIX backwardation. Namely that it hints markets participants may be beginning to panic.
If that is the case, an inversion should be rare:
The chart below shows the VIX futures curve dating back to late 2008. Red lines show inversion of the F1-F2 futures and blue shows the normal state. The X axis is each futures month up to month 6 while the Y axis is the volatility % implied by the future.
As you can see, inversion is indeed rare happening most often with the front month in the high teens to mid twenties and persisting all the way to the high 50s where a normal curve is *very* rarely seen.
VIX Backwardation

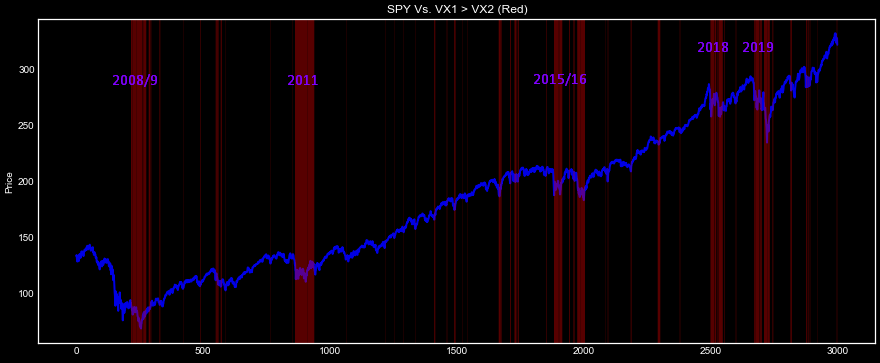
Likewise, on the chart below you can see via the clustered red vertical lines that inversion happens (and persists) during times of extreme stress (our data starts late 2008 for Vix futures). You can also see several individual or un-clustered red lines where the index rockets higher shortly thereafter.
SPY VS. VIX Backwardation

So what does that tell you about S&P500 and Volatility Returns when VX1>VX2?
It tells you to expect volatility of volatility and in that sense, opportunity. The first chart shows SPY 1 day returns when the VIX futures curve is in contango (blue distribution) Vs. SPY 1 day returns when the futures curve is backwardated (red distribution).

Our second chart shows front month VIX future 1 day returns similar to the above.

In both chart we notice that the red distributions (VIX futures backwardated) completely encapsulate the blue distributions. On the second chart we see a one day gain of over 100% in the volatility futures space.
In re-iteration of our first post and in conclusion to this post, we are comfortable saying that backwardation/inversion is a sign that market participants are beginning to panic.
In that sense we can use it as a risk mitigation tool, understanding the distributions of returns for the stock market and volatility when the futures are backwardated and when they are not.
We however can not necessarily use it alone as a timing tool. In the second chart in this post we see many stock market bottoms when the curve initially inverts.
When the VIX curve inverts pay attention, it could be a bottom. If you play it as a bottom understand that you are short convexity.
Pay attention to VIX backwardations, but combine it with other tools to help you understand if you are bottoming (2013 to 2014 and 2017), or if you are about to get your a*s handed to you (2011, 2015/2016, 2018 and 2019).
Track and backtest term structure data on www.tradewell.app.
Thanks!
